L6388E 查看數據表(PDF) - STMicroelectronics
零件编号
产品描述 (功能)
生产厂家
L6388E Datasheet PDF : 18 Pages
| |||
L6388E
7
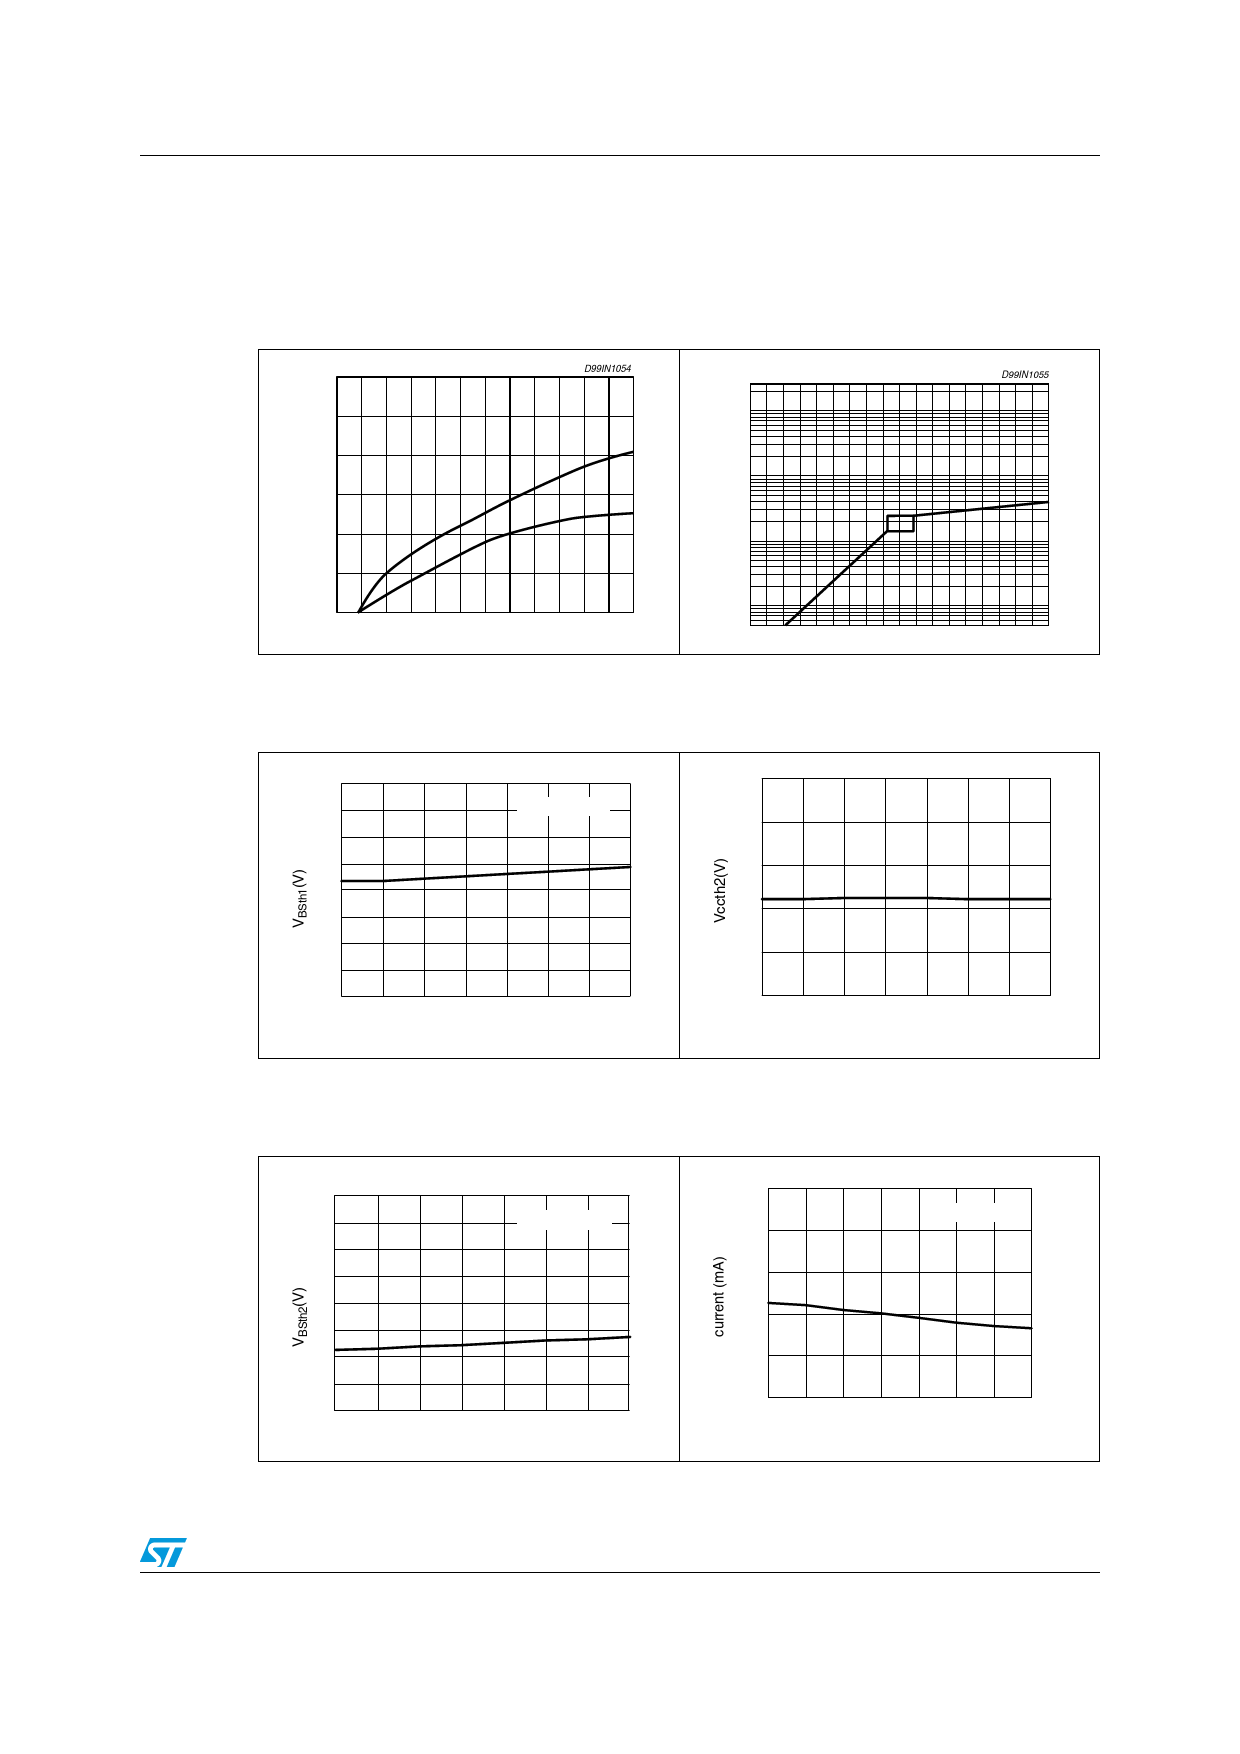
Typical characteristic
Typical characteristic
Figure 6.
time
(nsec)
250
Typical rise and fall times vs Figure 7.
load capacitance
D99IN1054
Iq
(µA)
104
Quiescent current vs supply
voltage
D99IN1055
200
Tr
150
Tf
100
50
0
0
1
2
3
4
5 C (nF)
For both high and low side buffers @25˚C Tamb
103
102
10
0 2 4 6 8 10 12 14 16 VS(V)
Figure 8. VBOOT UV turn on threshold Figure 9. VCC UV turn off threshold vs
vs temperature
temperature
13
12
11
10 Typ.
9
8
7
6
5
-45 -25 0
@ Vcc = 15V
25 50 75 100 125
Tj (˚C)
11
10
9
Typ.
8
7
6
-45 -25 0
25 50 75 100 125
Tj (˚C)
Figure 10. VBOOT UV turn off threshold Figure 11. Output source current vs
vs temperature
temperature
14
13
12
11
10
9
8
Typ.
7
6
-45 -25 0
@ Vcc = 15V
25 50 75 100 125
1000
800
@ Vcc = 15V
600
Typ.
400
200
0
-45 -25 0
25 50 75 100 125
Tj (˚C)
11/18
Share Link: 