MC100H641FNR2 データシートの表示(PDF) - ON Semiconductor
部品番号
コンポーネント説明
メーカー
MC100H641FNR2 Datasheet PDF : 10 Pages
| |||
MC10H641, MC100H641
propagation delay for the device in question. A more
common use would be to establish an ambient temperature
range for the H641’s in the system and utilize the above
methodology to determine the potential increased skew of
the distribution network. Note that for this information if the
TPD versus Temperature curve were linear the calculations
would not be required. If the curve were linear over all
temperatures a simple temperature coefficient could be
provided.
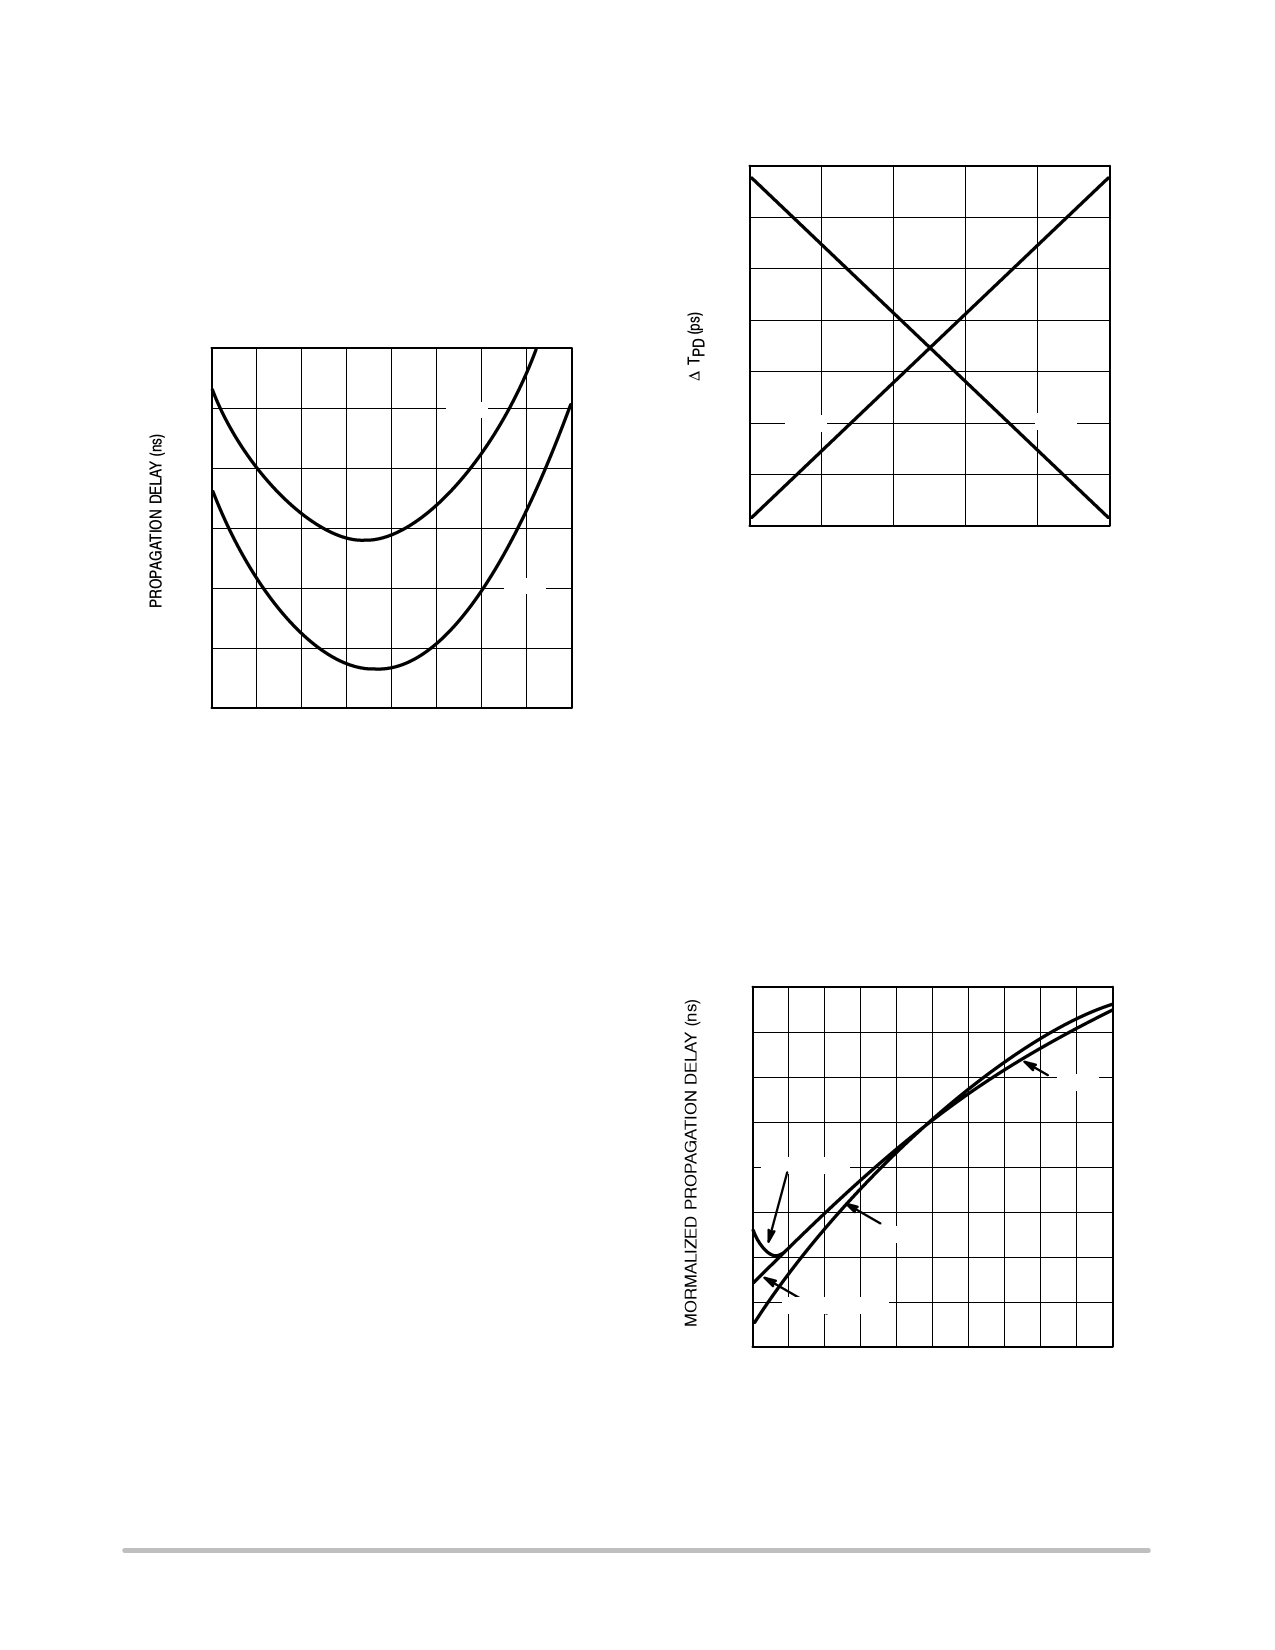
6.4
6.2
TPHL
6.0
5.8
5.6
TPLH
5.4
5.2
−30 −10 10 30 50 70 90 110 130
JUNCTION TEMPERATURE (°C)
Figure 3. TPD versus Junction Temperature
VCC Dependence
TTL and CMOS devices show a significant propagation
delay dependence with VCC. Therefore the VCC variation in
a system will have a direct impact on the total skew of the
clock distribution network. When calculating the skew
between two devices on a single board it is very likely an
assumption of identical VCC’s can be made. In this case the
number provided in the data sheet for part−to−part skew
would be overly conservative. By using Figure 4 the skew
given in the data sheet can be reduced to represent a smaller
or zero variation in VCC. The delay variation due to the
specified VCC variation is ≈ 270 ps. Therefore, the 1 ns
window on the data sheet can be reduced by 270 ps if the
devices in question will always experience the same VCC.
The distribution of the propagation delay ranges given in the
data sheet is actually a composite of three distributions
whose means are separated by the fixed difference in
propagation delay at the typical, minimum and maximum
VCC.
140
100
60
20
−20
−60
TPHL
TPLH
−100
−140
4.75
4.85
4.95
5.05
5.15
5.25
VCC (V)
Figure 4. DTPD versus VCC
Capacitive Load Dependence
As with VCC the propagation delay of a TTL output is
intimately tied to variation in the load capacitance. The skew
specifications given in the data sheet, of course, assume
equal loading on all of the outputs. However situations could
arise where this is an impossibility and it may be necessary
to estimate the skew added by asymmetric loading. In
addition the propagation delay numbers are provided only
for 50 pF loads, thus necessitating a method of determining
the propagation delay for alternative loads.
Figure 5 shows the relationship between the two
propagation delays with respect to the capacitive load on the
output. Utilizing this graph and the 50 pF limits the
specification of the H641 can be mapped into a spec for
either a different value load or asymmetric loads.
1.15
1.10
1.05
TPLH
1.00
0.95 MEASURED
0.90
TPHL
0.85
0.80
THEORETICAL
0.75
0
10 20 30 40 50 60 70 80
CAPACITIVE LOAD (pF)
Figure 5. TPD versus Load
90 100
http://onsemi.com
6
Share Link: 