HLMP-1601 View Datasheet(PDF) - Avago Technologies
Part Name
Description
MFG CO.
HLMP-1601
Avago Technologies
HLMP-1601 Datasheet PDF : 8 Pages
| |||
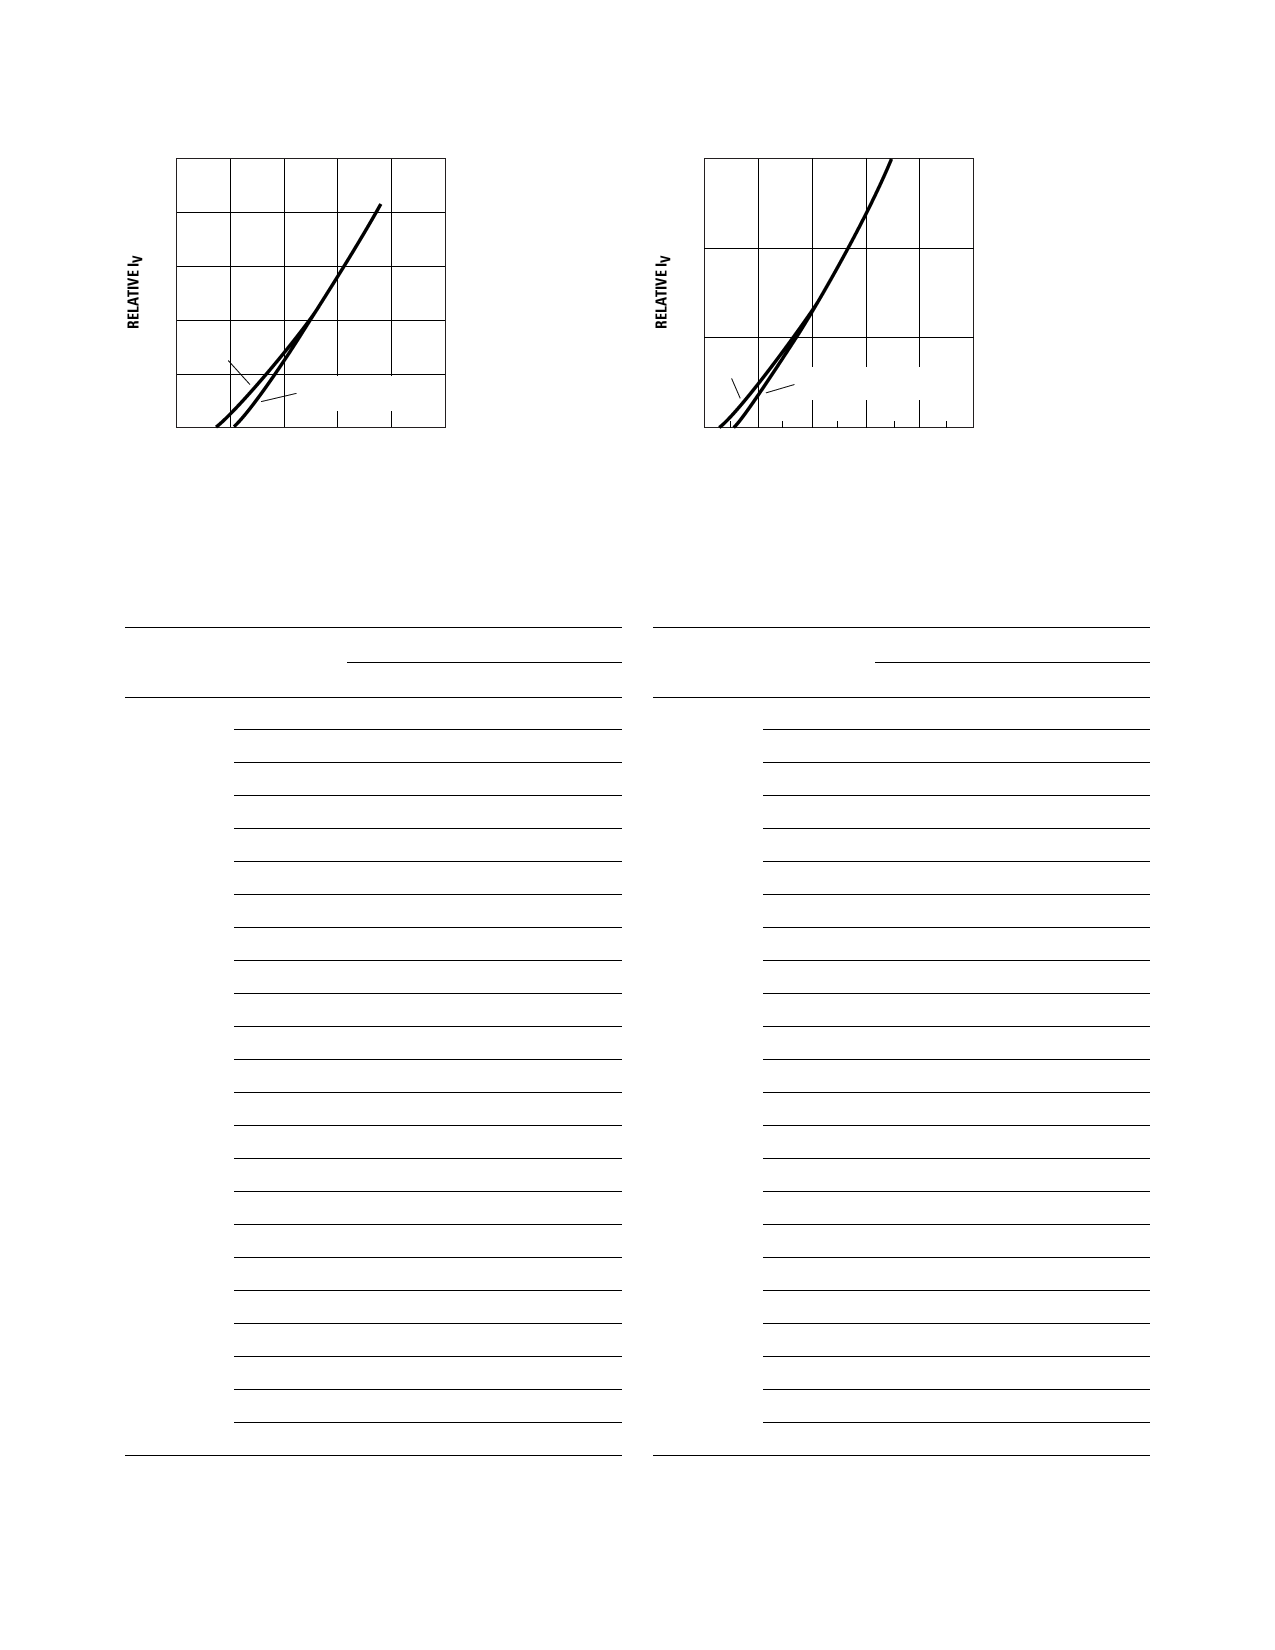
2.5
2.0
1.5
1.0
GaAsP
0.5
0
0
2
HIGH EFFICIENCY
RED, YELLOW, GREEN
4
6
8
10
5 VOLT DEVICES
Figure 7. Relative luminous intensity vs. applied forward voltage. 5 volt
devices.
1.5
1.0
0.5
GaAsP
HIGH EFFICIENCY
RED, YELLOW, GREEN
0
0 2 4 6 8 10 12 14 16 18 20
12 VOLT DEVICES
Figure 8. Relative luminous intensity vs. applied forward voltage. 12 volt
devices.
Intensity Bin Limit
Color
Bin
Intensity Range (mcd)
Min.
Max.
Red
D
2.4
3.8
E
3.8
6.1
F
6.1
9.7
G
9.7
15.5
H
15.5
24.8
I
24.8
39.6
J
39.6
63.4
K
63.4
101.5
L
101.5
162.4
M
162.4
234.6
N
234.6
340.0
O
340.0
540.0
P
540.0
850.0
Q
850.0
1200.0
R
1200.0
1700.0
S
1700.0
2400.0
T
2400.0
3400.0
U
3400.0
4900.0
V
4900.0
7100.0
W
7100.0
10200.0
X
10200.0
14800.0
Y
14800.0
21400.0
Z
21400.0
30900.0
Maximum tolerance for each bin limit is ±18%.
Intensity Bin Limit (Con't)
Color
Bin
Yellow
C
D
E
F
G
H
I
J
K
L
M
N
O
P
Q
R
S
T
U
V
W
Y
Z
Intensity Range (mcd)
Min.
Max.
2.5
4.0
4.0
6.5
6.5
10.3
10.3
16.6
16.6
26.5
26.5
42.3
42.3
67.7
67.7
108.2
108.2
173.2
173.2
250.0
250.0
360.0
360.0
510.0
510.0
800.0
800.0
1250.0
1250.0
1800.0
1800.0
2900.0
2900.0
4700.0
4700.0
7200.0
7200.0
11700.0
11700.0
18000.0
18000.0
27000.0
14800.0
21400.0
21400.0
30900.0
6
Share Link: 